
The Configuration/Data Sources screen is where you name a report, set where to store the report, establish the data source and parameters for the data, set other details to create or edit a report, and even the color theme for the report. It has two sections: Dashboard/Report Details and Data Sources.
Figure 67: Configuration/Data Sources screen
There are three ways to access the Configuration/Data Sources screen.
1. Creating a report (BI Tool Create a Report): From the BI Tool Homepage > header, click the Add icon (+) to prompt the Configuration/Data Sources screen.
2. Editing an existing report (BI Tool Edit a Report): Working with the report to be edited on the screen, click the Edit icon (the pencil) in the header, which will prompt the Configuration/Data Sources screen.
3. When working on the BI Tool Dashboard/Report Edit screen, the white tab on the left of the screen is named Configuration/Data Sources (Figure 68). Click the tab to go to the Configuration/Data Sources screen (see BI Tool Dashboard/Report Edit). NOTE: Once a report is named, “Dashboard/Report Edit” no longer appears at the top of the screen, as shown in the header of Figure 68. The name of the report willb e is what is shown on that screen.

Figure 68: Click to access Configuration/Data Sources
To unselect a report that has been set as the default:
Step 1: After choosing the edit icon from the Homepage for the report, unselect the Default toggle.
Step 2: Click the checkmark to save that setting within Configuration/Data Sources.
Step 3: Click the checkmark on the report. See Figure 69 for each step. Not clicking the checkmark on Step 3 and instead clicking the X to exit will not retain that setting on the report.
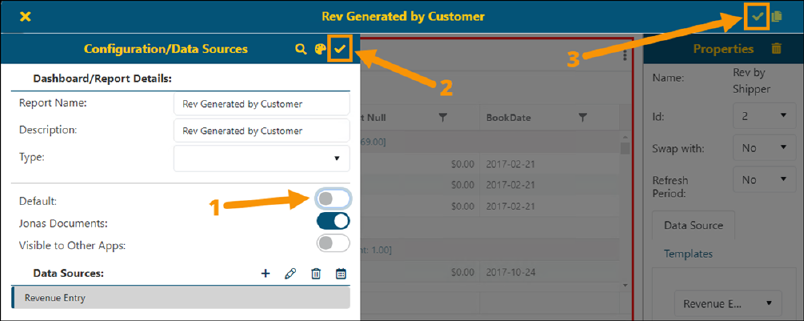
Figure 69: Follow these steps to unselect a default report.
The following information includes description for each of the options or fields for the Configuration/Data Sources screen.
|
Icon |
Function |
|
Dashboard/Report Details: | |
|
|
Color Themes icon Click to choose or customize a theme for this report/dashboard. Please refer to BI Tool Adding and Editing a Color Theme to learn how to use this feature. |
|
|
Save icon After entering the desired parameters, click this icon to Save and proceed to Dashboard/Report Edit (See BI Tool Dashboard/Report Edit) |
|
Report Name |
This will the name of this report. The field allows up to 25 characters. The Report Name displays in the BI Tool Report Listing and at the top of the report when it is open. |
|
Description |
Optional: Enter a description of the report. The description will be included in the Report Name when viewing the report. The report name and description in Figure 67 would read “Sales Numbers -Sales Person True Up” when viewing the report. |
|
Type |
The options available reflect your personal BI Tool Report Listing. This is where you select where this report will be located. The options available are set in BI Tool Administration. |
|
Default |
If Default is selected, then this report will be the report that is on your BI Tool home screen when you log in to the BI Tool. |
|
Jonas Documents |
Not Applicable. |
|
Visible to Other Apps |
Not applicable. |
|
Data Sources: | |
|
This sections is where you choose what data will be used for this report. When creating a new report, this will be blank. Use the Add icon to add a data source. Once the parameters are set on the Data Sources screen and saved, the data source created will be listed here. See BI Tool Data Sources for more information. | |
|
|
Add icon Click this icon to add a Data Source to this report. Clicking this icon will bring up the BI Tool Data Sources screen, where the data source and parameters can be set for that data source. |
|
|
Edit icon Click this icon to access the BI Tool Data Sources screen to edit an existing Data Source for the report/dashboard that is open when the edit icon is clicked. |
|
|
Delete icon This icon will delete a selected Data Source for this report/dashboard. |
|
|
Scheduling icon The Scheduling icon allows for setting a schedule to have reports build into cache at a pre-determined time. Using scheduling will dramatically improve performance within the BI Tool effectively. It is best to set schedules based on the likelihood of how these views will be used in reports and when people will likely access them (hourly, daily, monthly etc.).
Note: If scheduling is on, the user will have access to rebuild the reporting cache on the fly and will get notice once complete. “Rebuild Cache” can be accessed from the opened report by clicking the ellipses (three dots) to show this option. If a cache is not scheduled, the “Rebuild Cache” option will be greyed. |
RELATED INFORMATION:


