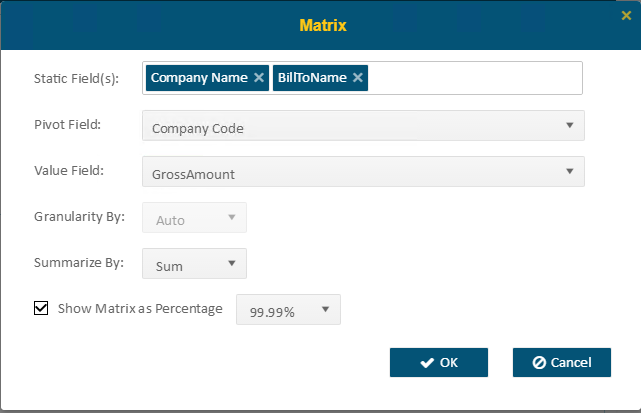
When selecting a Matrix, this will allow you to select the Static Fields (which are row labels), Pivot Field (which is a column label) and the Value Field (the value which is summarized in each cell.)
•If you choose a date column as the Pivot Field, then you can choose Auto / Year / Quarter / Month in Granularity By.
•The option Summarize by will add an extra column at the end of report, and calculate the Average or Sum of each column.
•If Show matrix as Percentage is selected, then the totals will be shown as percentages of a line total