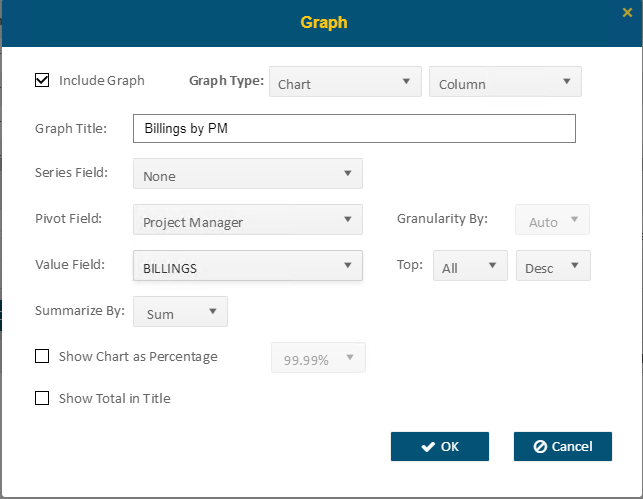
The Graph option will allow you to set up Graph Type, Graph Title, Series Field (which is used for multiple series in a chart), Pivot Field (which is the field that the value chosen is grouped by) as well as the Value Field (which is the summarized value for each group). Option Include Graph decides whether the graph shows in the report.
Graph type: Chart
•Choose the chart type in the dropdown list on the right
•If you set a date column as a Pivot Field, then you can choose Auto / Year / Quarter / Month in Granularity By
•The option Summarize by allows summarization to be Average rather than just a Sum
•If Show Chart as Percentage is selected, then the label will be shown as percentages of total
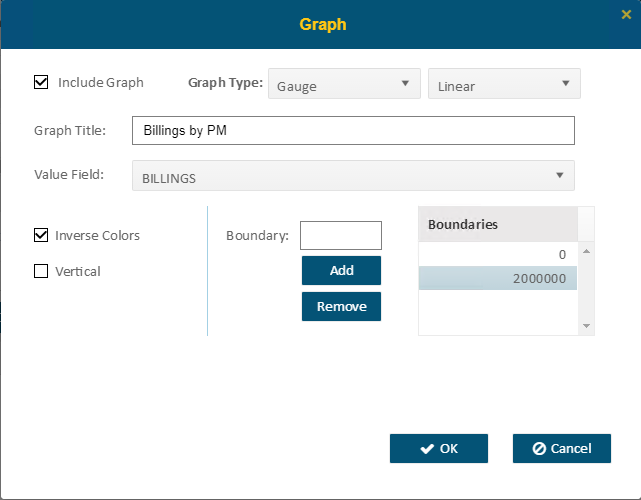
Graph type: Gauge
When users choose Gauge, there are two options of graph: Linear or Radial
Users need to enter the boundary values in gauge and will need to enter at least two values to build the graph successfully. Input the value in the Input box and click Add to save the value. Select a value from the list and click Remove can delete it. The boundary values are dependent on your report and field value.
•Option Inverse Colors can switch the gauge range color
•Option Vertical will allow users to have the linear gauge display vertically.