Once a report is selected, the screen will be divided into two sections.
The
Resize/Collapse button  located between the two sections
will allow you to drag and re-size or expand/collapse each section.
located between the two sections
will allow you to drag and re-size or expand/collapse each section.
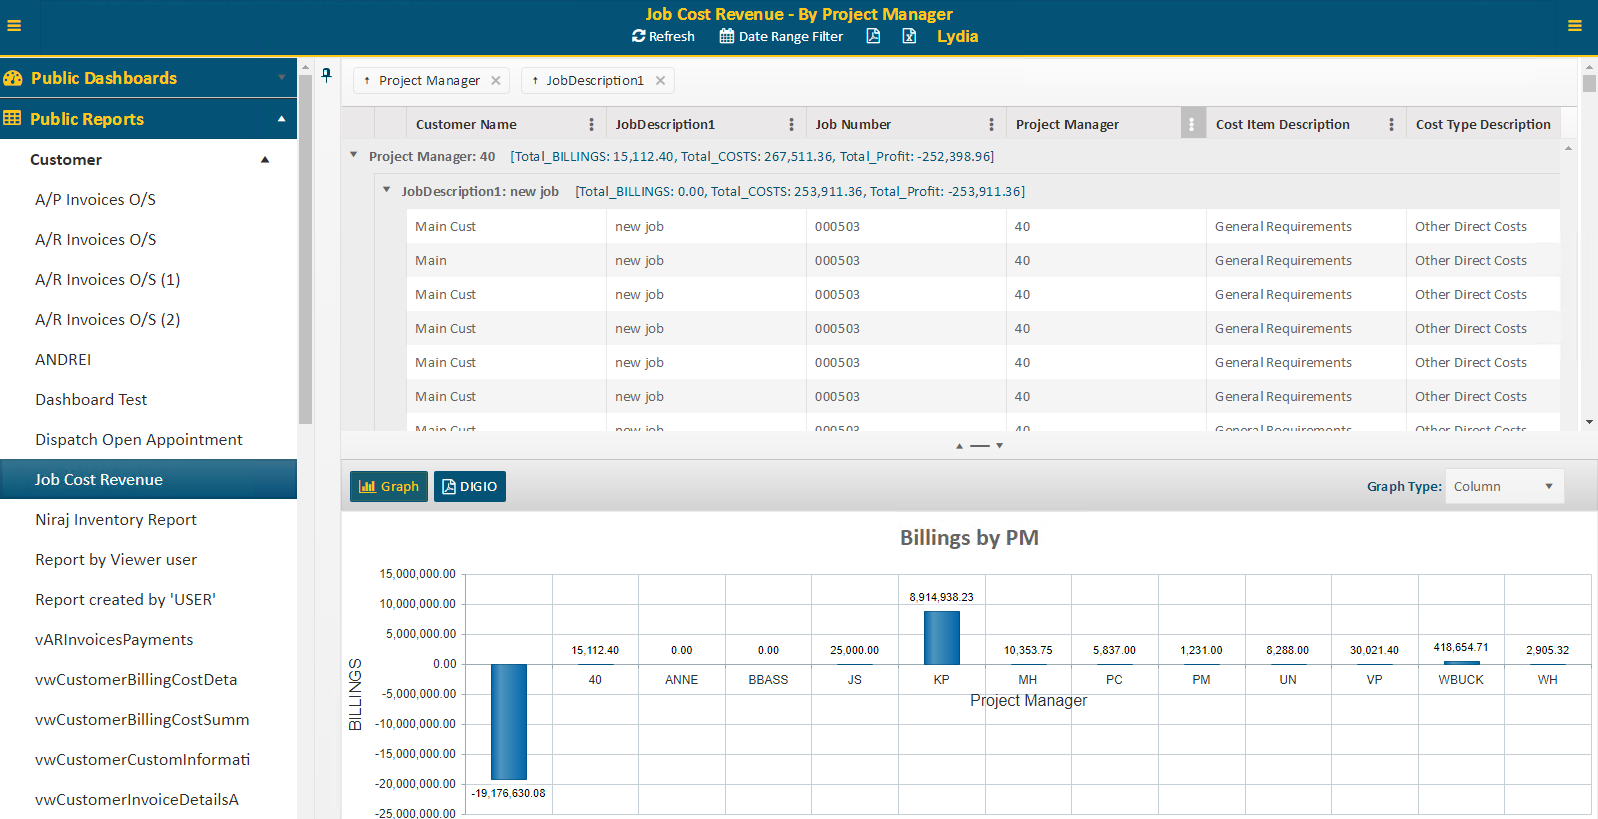
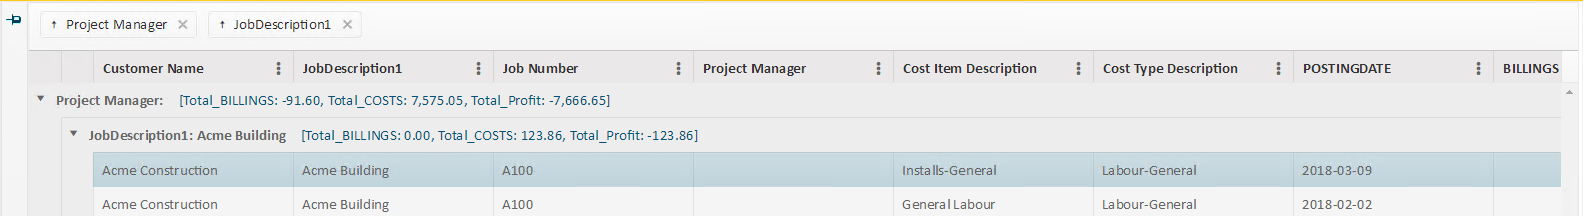
The top half of the report screen will display selectable rows of data, which will determine what will be displayed in the bottom section of the screen.
The bottom half of a report screen will display two different types of information dependent on how the report was created.
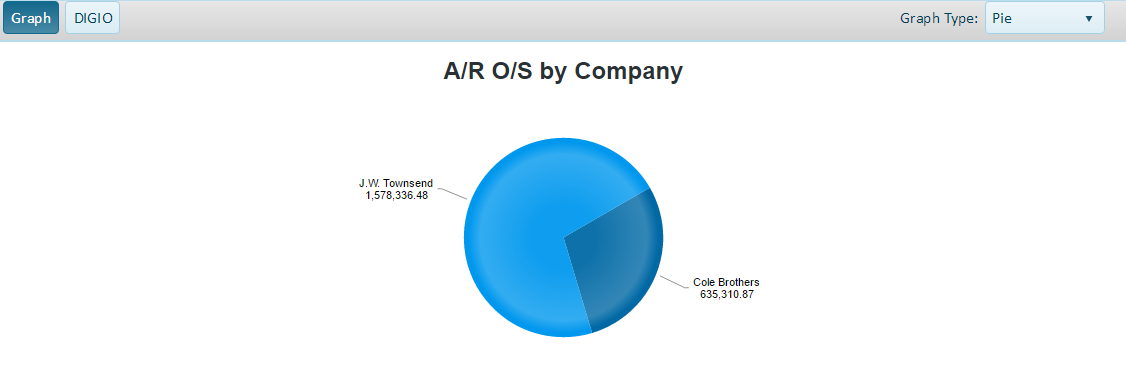
•If the <Graph> button is selected, it will show various styles of graphs representing the report data. The Graph Type list can be used to change the type of graph displayed.